We are the world experts for remote sensing and AI in forestry and forest carbon. Our #forestAi technology is your toolbox to solve your specific forest analytics problem.
Fast. Precise. Scalable.
We guide you through the available technology solutions, working with you to find the set-up that is right for you – combining your traditional methods with cutting edge remote sensing and artificial intelligence. And because we have been focussed on forestry since 2016, we speak your language. Wherever you are based.
SOME OF THE STUFF WE DO
Forest Health Monitoring
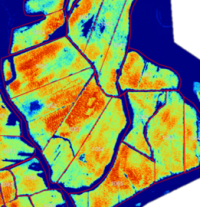
Do you need a regular health check of your forest to be alerted to negative changes caused by drought, disease or other stresses?
Our Forest Health Monitor provides fast and reliable updates on the state of your forest and highlights problem hotspots. Monthly, quarterly or annually.
Seedling Survival Survey
Do you want a fast and precise assessment of the survival rate of new plantings to take targeted action for maximum stocking?
With our Seedling Counter you will get precise results of seedling density, weed cover and vitality – to detect nutrient deficiencies and enable more accurate productivity projections.
Forest Carbon
Are you seeking a cost efficient and precise monitoring process for your forest carbon project?
Our Carbon Solutions combine the optimal toolset for projects ranging from re-/afforestation and forest protection to agroforestry systems and mangrove restoration.
Damage Assessment
Have you had a recent storm, fire or other calamity in your forest?
We run a fast and precise Damage Assessment to show you all affected areas at a glance. Not only that, we also differentiate the severity of the damage so you can prioritize your clean-up and restoration actions.
Stocking Density
Is stocking density one of your most important forest metrics but you‘re still extrapolating from small sample plots?
Our Tree Counter and Canopy Gap Analysis shows you the stocking density on the entire forest with all its variations for yield projections or to guide thinning operations and optimise land use for maximum productivity.
Stratification
Are you looking at a new investment target, a potential carbon project or just want to optimise your sample design?
Our Stratification tools use aerial or satellite data to provide you with a detailed stratification into the classes defined by you.
we work ARound the world
Our clients include the biggest forestry companies as well as conservation managers and forest carbon projects.
“We gain a much better understanding of the state of our forests and can make more suitable silvicultural decisions on a compartment level. We were impressed by the accuracy of the Ai tree count results. We’ve also learnt a lot through our journey with SKYLAB and definitely recommend them for any tree count and health analyses.”
“We tested the TreeCounter and tree-level health analysis and are extremely happy with the results, we are expanding the area for SKYLAB analyse to help reduce the use of chemicals and improve overall productivity.”
“The SKYLAB Seedling Counter actually is a plantation assessment that captures so much more information than we have ever had in the past. And all of the additional products, such as weed and vitality maps, are bonuses that have massive potential for further silvicultural gains. [On the cloud] I really like it! It gives me full visibility and control over each project. The interface is excellent and very intuitive.”
“We are impressed with SKYLAB’s capabilities in delivering high quality results with efficiency and accuracy. Skylab is very responsive to requests or questions and respectful our management needs. Analysis results and the maps produced are valuable tools in our forest operations and help to focus our activities on any problem hotspots, saving us time and resources in reducing the negative impact of disease on our forest productivity.
We can definitely recommend the use of SKYLAB services for forest health and change monitoring.”
Our #forestAi toolbox has four compartments
Just mix and match them as you need
STEM COUNT /STOCKING
- Seedling survival monitoring, weed cover and seedling vitality assessment
- Tree density count for thinning and harvest optimisation
- Canopy cover and gap analysis for assessing stocking variation and highlighting problem areas
CHANGE
- Damage assessment
- Change in vegetation cover
- Regular forest health assessment
- Quantify harvest operations or detect illegal logging
CARBON
Optimise your carbon project monitoring and transparent reporting with more precise data covering the whole project area.
- Historic land use and stratification
- Regular monitoring of vegetation cover and changes over time (annually or even quarterly)
- Baseline assessment and project monitoring
- Transparent mapping for better reporting
- Full biomass and carbon inventories using advanced AI modelling
ORTHOFOREST+
The best orthophotos, specifically optimised for a forestry context, with no distortions or fragments!
- Just upload your raw aerial
image data to our online
platform, the SKYLABcloud - Our orthophotos are
specifically optimised for
forestry settings - No need to handle or store
large file sizes
SKYLABcloud
Upload your drone images to the SKYLABcloud
Download all results, data and maps to integrate into your own GIS solutions.
Data quality is the single most important factor…

Multispectral or normal colour data?

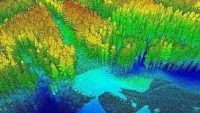
Laserscanning (Lidar) or photogrammetry?

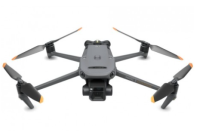
How to fly my drone?
We help you select the most suitable data source to find the perfect balance between accuracy and cost-efficiency. We advise you on drone flight settings or help you find a suitable service provider. We find the best satellite imagery from dozens of providers, ranging from 10m to as little as 30cm resolution. And we advise you on plane flights and whether you should use laser scanning (aka Lidar) or cheaper photogrammetry.


